Skip to content
About
About Overview
Staff
Opportunities
FAQ
Project 76
Philadelphia Agreement Overview
Accessibility Consulting
Notable
ACCESS
ACCESS Overview
Purchase ACCESS Card
Participating Organizations
Programs
Programs Overview
ACCESS
ACCESS Overview
Purchase ACCESS Card
Participating Organizations
Member Organizations
Member Organizations Overview
Member Organizations Login
Accessibility Basics
Community Learning
Strategic Accessibility Planning
STAMP
News
Donate
Search
Mobile Navigation Menu
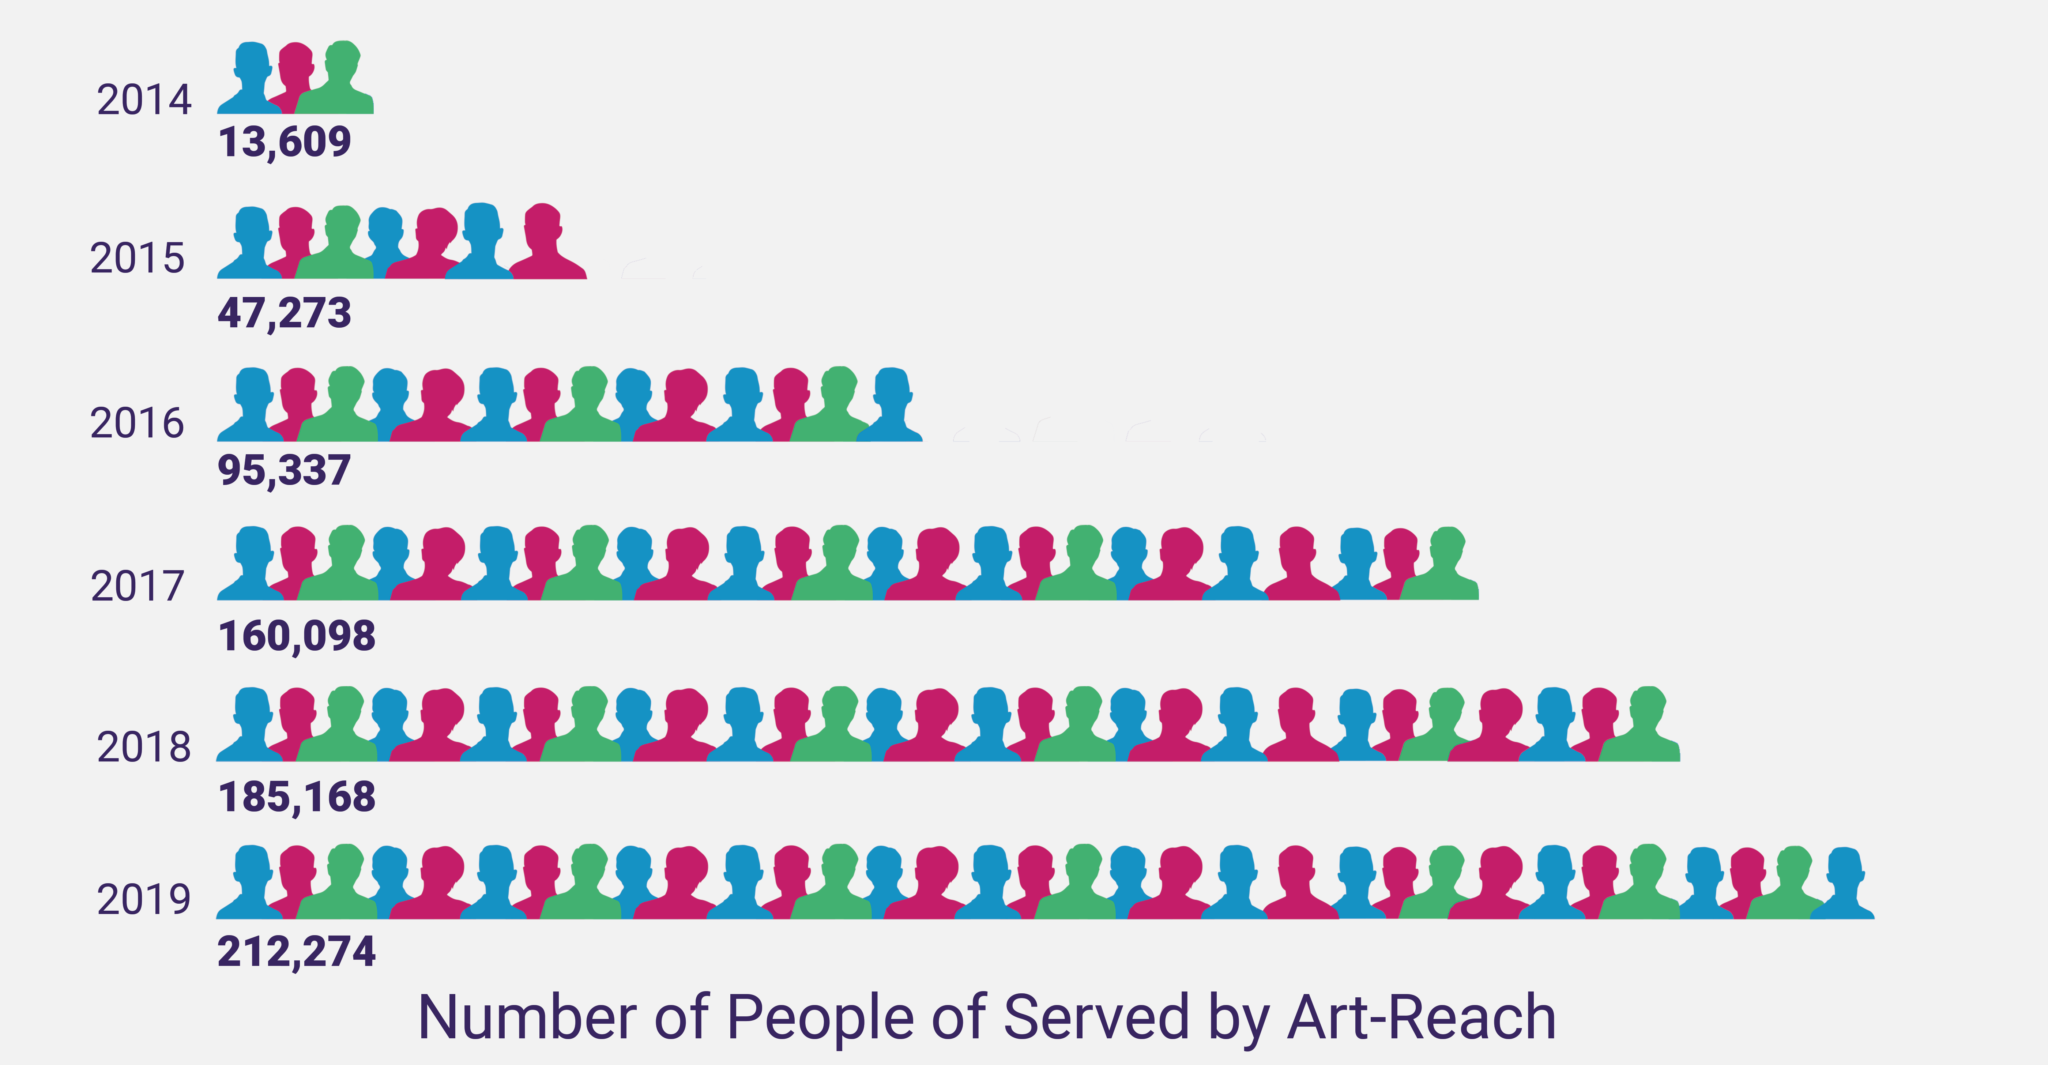
FY 20 Impact numbers _ All programs
Leave a Reply
Your email address will not be published.
Required fields are marked
*
Comment
*
Name
*
Email
*
Δ
About
About Overview
Project 76
Accessibility Consulting
Philadelphia Agreement Overview
Notable
Staff
Opportunities
FAQ
About Overview
Project 76
Accessibility Consulting
Philadelphia Agreement Overview
Notable
Staff
Opportunities
FAQ
Access
ACCESS Overview
Purchase ACCESS Card
Participating Organizations
ACCESS Overview
Purchase ACCESS Card
Participating Organizations
Programs
Programs Overview
ACCESS
ACCESS Overview
Purchase ACCESS Card
Participating Organizations
Member Organizations
Member Login
Member Organizations Overview
Accessibility Basics
Community Learning
Strategic Accessibility Planning
STAMP
Programs Overview
ACCESS
ACCESS Overview
Purchase ACCESS Card
Participating Organizations
Member Organizations
Member Login
Member Organizations Overview
Accessibility Basics
Community Learning
Strategic Accessibility Planning
STAMP
News
Donate